Oncall Adventures - When your Prometheus-Server mounted to GCE Persistent Disk on K8s is Full
Running out of space, but in the cloud.

I'm a developer from Vancouver, BC who's had an interesting journey in tech starting from support, through cloud infrastructure and project management. Currently I work as an SRE at lightstep helping build and "operationalize" things that helps to guide others towards better o11y :)
Note to anyone that lands on this page in the middle of an Incident and just ✨ needs the solution ✨ .
Problem: Prometheus-server running in K8s on GCP using a Persistent Volume has run out of disk.
Symptoms:
- Grafana shows readings diving off cliff.
- Grafana shows no data.
- No screaming from other independent sensors (i.e. other teams)
- Logs on Prometheus-server show:
target=http://XXX.XXX.XXX.XXX:YYYY/metrics msg="Scrape commit failed" err="write to WAL: log samples: write /data/wal/00004932: no space left on device - Shelling into Prometheus-server confirms 100% disk usage.
Fix:
- Remove link to filled Persistent Volume.
- Mount debug pod onto Persistent Volume.
- Clean-up old blocks in
/data - Kill debug pod and remove link to Persistent Volume
- Restart Prometheus-server
- Wait 2 hours for pruning to finish

Photo by Annie Spratt on Unsplash
PagerDuty Alert. You have 1 triggered notification...
That's the phone-call I was woken up with this morning at 3:30AM Pacific Time.
This was my first time getting paged in the middle of the night at this job, but the response felt very rehearsed. On-call work is one of the less glamorous but still important, parts of the job - and if you've done it for a couple iterations (and been through a couple of high-intensity outages), it becomes just another activity.
As I rolled out of bed and shuffled over to my desk - I remembered something an old mentor told me as a Junior:
After a while, you'll start seeing the patterns and see that almost every issue you deal with stems from a few specific blueprints.
Sure enough, the incident we worked through last night had a very common culprit - resource exhaustion.
Here are some lessons we learned from this incident:
 Photo by Launde Morel on Unsplash
1. If All Your Gauges Go Dark but No One Screams, It's Probably Your Gauges.
The majority of our infrastructure runs on Kubernetes (K8s) which is a container orchestration system.
For observability (o11y) - we make use of Prometheus which works by scraping metrics from our containers and then pushes them to Grafana cloud for data visualization and export.
This is also where our alerts are configured and how we can paged if something seems wrong.
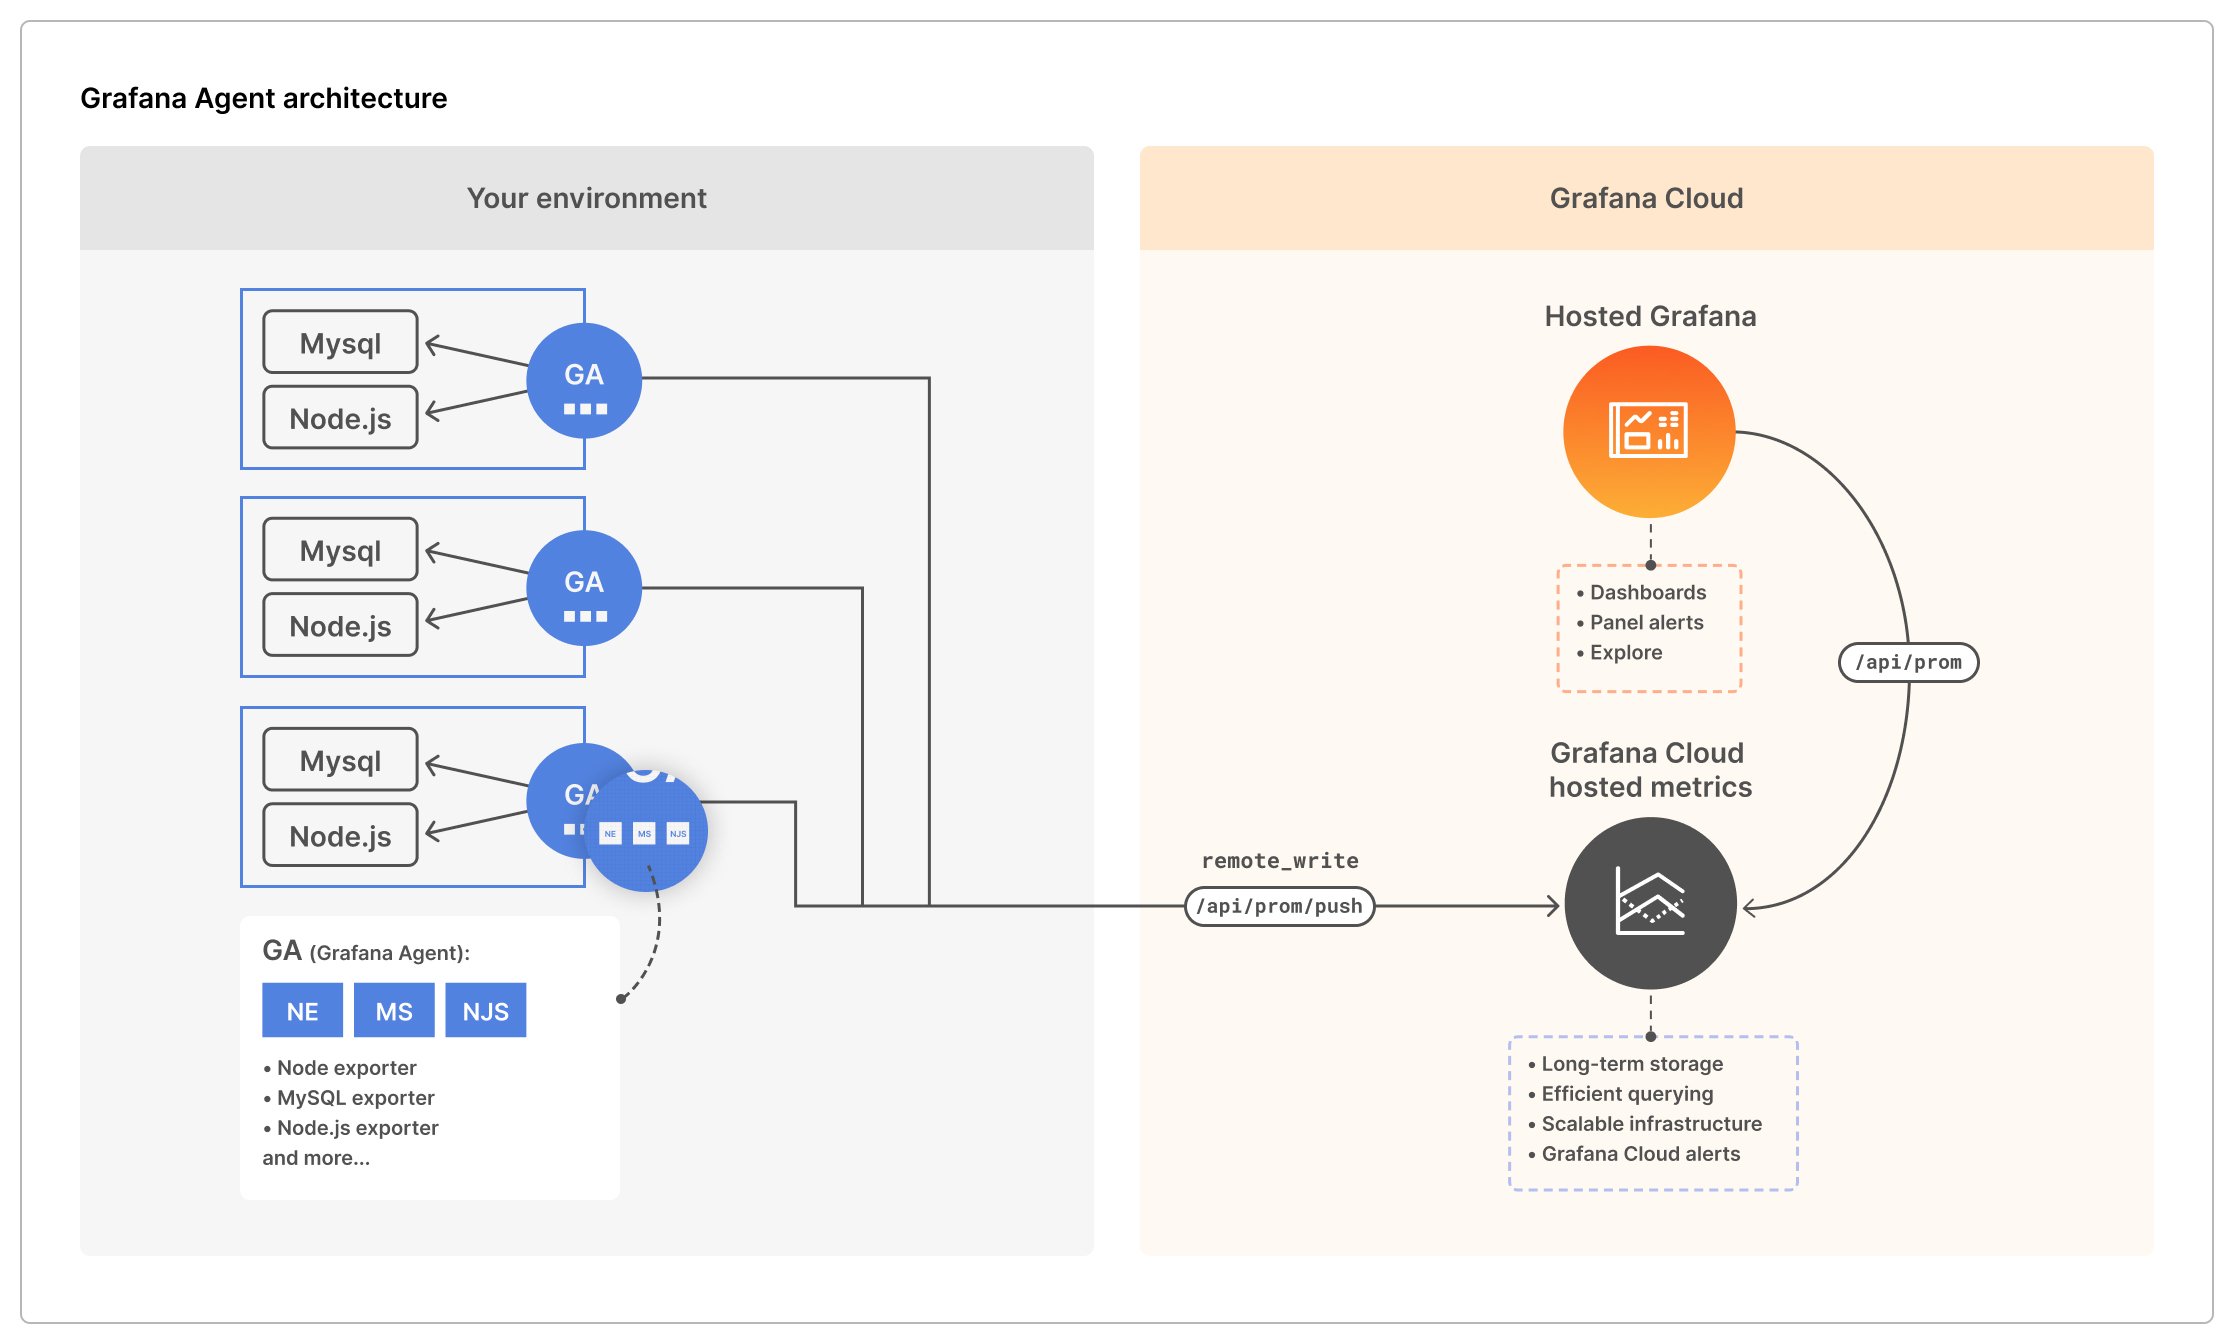
To understand this setup, there's 2 diagrams:
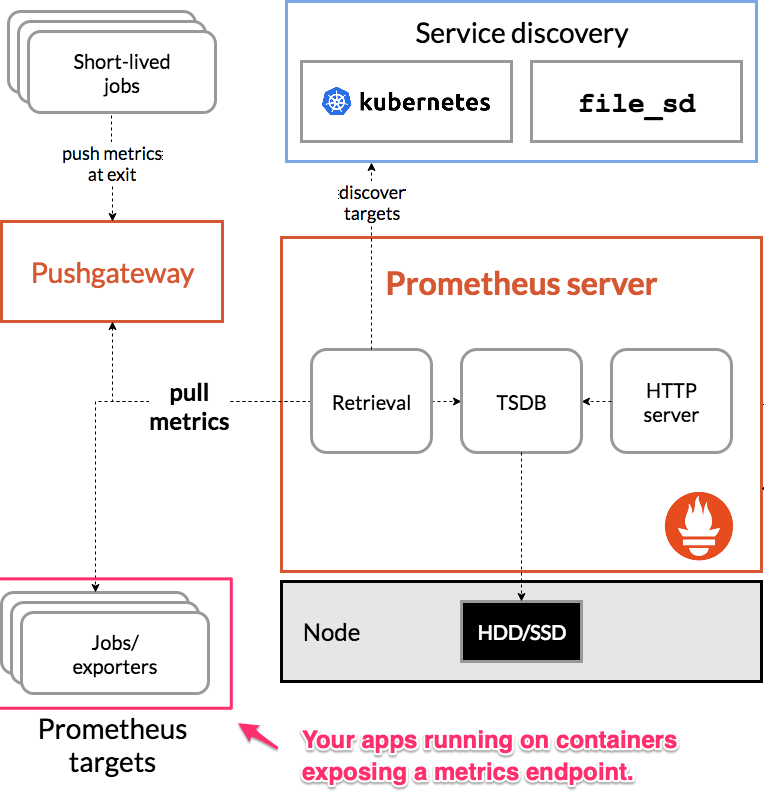
You'll need to be in light-mode to see the arrows in this diagram 😞
And the Grafana agent which is on the Prometheus-server and sends the metrics off to Grafana cloud.
The first thing I woke up to was our dashboards showing metrics either:
- Diving off a cliff; or
- Going dark.

One thing I've learned over time is that while our eyes naturally fixate on anomalies in patterns - it's important to take a look at the bigger picture before diving deep into a single graph.
Specifically, in this case - I saw that all of our graphs were showing the same behaviour (either a steep drop, or lack of data).
This, combined with the fact that no-one else was screaming (our product-engineering teams also have their own monitoring set up more specific to their use) gave me a hunch that these readings might be an issue with our observability into the system than a reflection of the system itself.
To confirm this, I wanted to test one of the claims from our monitoring system.
All CPU usage has dropped, memory usage has dropped, your containers are probably dead in the water.
So I logged into the cluster, and thankfully - I found that our pods and containers were swimming along just fine.
The combination of these 3 factors:
- All metrics dropping at the same time;
- No other alert of issues from an an independent source (i.e. a product engineer);
- The core claim of large scale outage being confirmed false
Led me to the following assumptions:
- The infrastructure is still okay.
- The monitoring system is probably degraded.
- We're not getting any more data.
Lets poke at the monitoring system!
 Photo by Mathias P.R. Reding from Pexels
2. Kubernetes is Just a Wrangler for Your Containers, They Still Need to Eat.
Kubernetes just co-ordinates your containers to get them housed (scheduled) and fed (resourced). If they can't, Kubernetes will try its best - but they don't (and can't) send notifications. This is where a monitoring solution like Prometheus comes in. It reports a constant stream of data about what it sees from looking at your app and sends it to Grafana for further visualization and alerting.
In this case, it just so happens that the monitoring system was what was degraded. But how?
Prometheus runs as pods on the cluster and essentially lives to scrape metrics from other containers and send them out. At the end of the day, it's just another creature (container) that needs food (resources) to live (do its job).
The main 4 resources that any container needs, organized by what they do — are:
- The ability to do things - processing, CPU
- The ability to use short-term memory - memory, RAM
- The ability to use long-term memory and carry assets (like a backpack) - DISK
- The ability to talk to others - networking (an IP, port, socket, actually networking has a little more requirements).
If any of these 4 resource requirements are not met, your workloads will fail.
While I'd love to say I have a tried and true method for checking all of these 4 things, the problem in this incident was uncovered by shelling in and taking a look at a couple of things.
One thing that really helped was the use of K9s - which makes it very easy to see the state of a Kubernetes object when listing them. For example when listing pods, you can see whether they’re running or experiencing issues from the same screen rather than having to list and then describe. A small but appreciated efficiency.
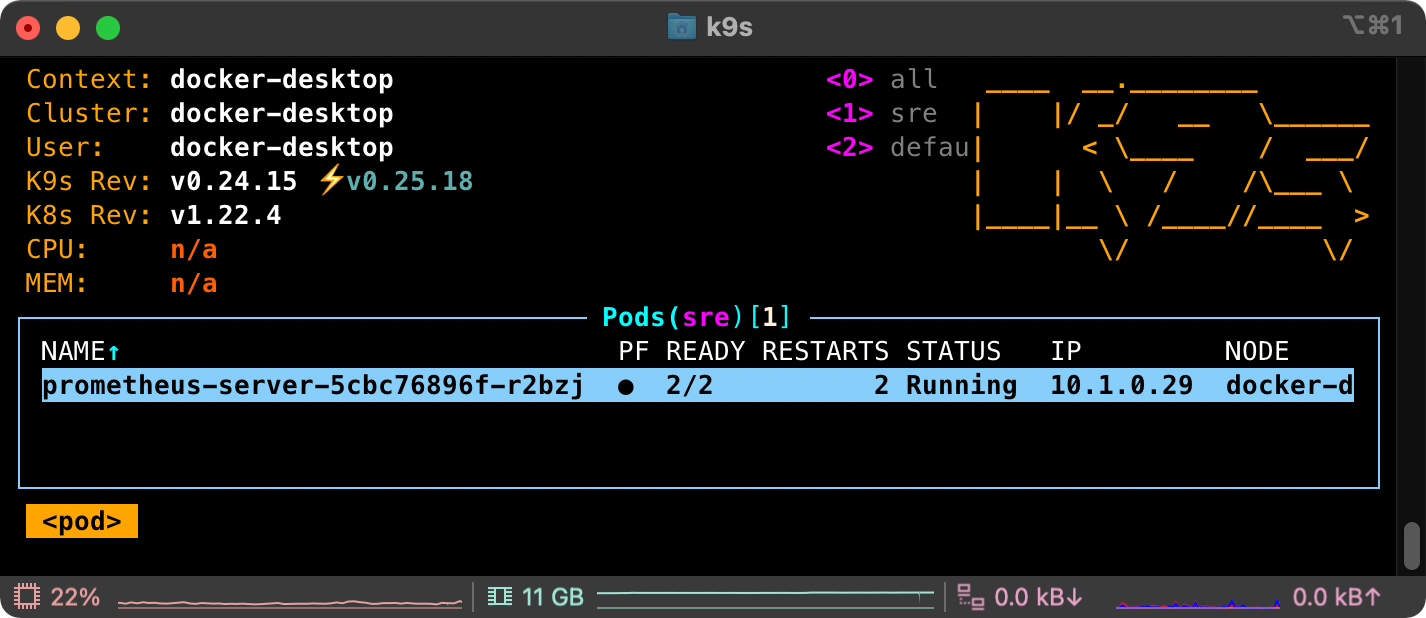
It also allows you to quickly view the logs of a container and see what's going.
For me, I was able to find the smoking gun quickly (and luckily) by checking the logs of the prometheus-server which was pumping out the following message a couple of hundred times per second:
target=http://XXX.XXX.XXX.XXX:YYYY/metrics msg="Scrape commit failed" err="write to WAL: log samples: write /data/wal/00004932: no space left on device"
⚠️no space left on device⚠️
Which was confirmed by doing a quick df which shows
Filesystem           1K-blocks      Used Available Use% Mounted on
[...]
/dev/sdb              51290592  48898732   2375476  100% /data
Alright, so our disk is full - how do we fix this?
I'll tell you how you shouldn't:
1. Do NOT move blocks from /data into other drives.
While this shell-game will buy you some-time - the WAL (Write Ahead Log) will continue to fill you will simply be prolonging the same issue.
More on the WAL:
The current block for incoming samples is kept in memory and is not fully persisted. It is secured against crashes by a write-ahead log (WAL) that can be replayed when the Prometheus server restarts. Write-ahead log files are stored in the wal directory in 128MB segments. These files contain raw data that has not yet been compacted; thus they are significantly larger than regular block files. Prometheus will retain a minimum of three write-ahead log files. High-traffic servers may retain more than three WAL files in order to keep at least two hours of raw data. - Ref
You should be very careful when fiddling with WAL files, as corruption will mean the inability for Prometheus to restart cleanly.
2. Do NOT resize the Persisted Volume by editing the the deployment spec on the fly.
Both of these action led to the following outcome when trying to restart Prometheus:
err="opening storage failed: repair corrupted WAL: cannot handle error: open WAL segment: 0: open /prometheus/wal/00000000: no such file or directory"
Well, what now?
While I wish I could say we knew exactly what to do and arrived at the solution immediately - there were a couple more learning experiences. We ended up:
- Attempting to restart the Prometheus-server in a zombie state so that we could remove that corrupted WAL.
- We couldn't. The container would die immediately before we could shell in.
- Killing the Prometheus-server deployment and hoping it would restart cleanly.
- It didn't.
Finally, we:
- Deleted the Persistent Volume that was maxed out.
- Re-deployed the Prometheus-server via Helm chart using our CI/CD.
Which now, after doing some more research - turns out is just a clumsy and more long-winded way of doing exactly what the Prometheus docs tell you to do:
If your local storage becomes corrupted for whatever reason, the best strategy to address the problem is to shut down Prometheus then remove the entire storage directory. You can also try removing individual block directories, or the WAL directory to resolve the problem. Note that this means losing approximately two hours data per block directory. Again, Prometheus's local storage is not intended to be durable long-term storage; external solutions offer extended retention and data durability. - Reference
cool. cool. cool. cool. v nice.
👍
 Photo by Jessica Lewis Creative from Pexels
3. Persistent Volumes & Persistent Volume Claims - There Can Only be One
In Kubernetes, you can mount volumes on your containers. There are a whole bunch of different mounts that can be configured and in our case, we were using a GCE Persistent Disk which is a type of Persistent Volume.
A Persistent Volume (PV) is one where the disk is linked to block storage that can survive if a container, pod or even deployment goes down. So in our case, even if our prometheus-server goes down - the data it saw will be available on disk. Kinda like an off-site black-box.
When dealing with Persistent Volumes, it's important to understand their relationship with Persistent Volume Claims (PVC).
A Persistent Volume Claim specifies a request for storage by a user. It can then be used within a Deployment spec as the volume to mount for a container.
The important thing to note is that there can only be 1 ReadWrite mount per Persistent Volume (more on that later).
This is what the yaml for a PVC looks like:
apiVersion: v1
kind: PersistentVolumeClaim
spec:
  accessModes:
    - ReadWriteOnce
  resources:
    requests:
      storage: "50Gi"
- Important to note that in GKE - having this included in a PVC automagically takes care of provisioning a volume in the background.
And here is the yaml for our Prometheus server mounting that persistent volume as storage-volume
apiVersion: apps/v1
kind: Deployment
metadata:
  labels:
    [...]
  name: prometheus-server
  namespace: sre
spec:
  selector:
    matchLabels:
      [...]
  replicas: 1
  template:
    [...]
    spec:
      enableServiceLinks: true
      serviceAccountName: prometheus-server
      containers:
        [...]
        - name: prometheus-server
          [...]
          volumeMounts:
            [...]
            - name: storage-volume
              mountPath: /data
              subPath: ""
            [...]
      [...]
      volumes:
        [...]
        - name: storage-volume
          persistentVolumeClaim:
            claimName: prometheus-server
The reason this is important to understand is because there was a fix we could have done.
Refer back to 0th thing we tried when we got:
err="opening storage failed: repair corrupted WAL: cannot handle error: open WAL segment: 0: open /prometheus/wal/00000000: no such file or directory"
- Attempting to restart the Prometheus-server in a zombie state so that we could remove that corrupted WAL (which ended up being futile).
We wanted to get the Prometheus-server up because we thought that was our only way to touch the volume and delete the corrupted WAL, but we couldn't get it up and running long enough to shell into it 😠 .
Looking back at it now, something we should have tried is what this person recommended in a Github issue: https://github.com/kubernetes/test-infra/issues/20439#issuecomment-759119197 which is to:
Use a different container to mount and clean the Persistent Volume
 Photo by Mati Mango from Pexels
4. How to Create a Debug Pod and Mount it to a Persistent Volume
A GCE Persistent Disk is like a hard drive.
Just like you can't plug a single hard-drive into two computers at one time,
A key constraint of a GCE Persistent Disk is that it can only be mounted in ReadWrite mode to a single node at any given time. (However, you can have multiple ReadOnly mounts)
Therefore, in order to get in and clean-it, you need to follow this order of operations:
1. Remove any Existing Associations (from Prometheus-server) to the Volume.
This can be done by either scaling down the Prometheus-server replicas from 1-0, or simply deleting the deployment.
2. Create a Debug pod (running Alpine) to Mount the Disk.
If I were to do it again I'd create a Debug pod file like this:
apiVersion: v1
kind: Pod
metadata:
  name: debug
spec:
  - name: debug-container
    image: alpine:latest
    imagePullPolicy: Always
    args: ["tail", "-f", "/dev/null"]
    volumeMounts:
    - mountPath: /data
      name: storage-volume
  volumes:
  - name: storage-volume
    persistentVolumeClaim:
      claimName: mount-for-debug
- The
tail -f /dev/nullis a way to ensure that the container stays up so you can shell into it.
3. Shell into Persistent Volume and Clean-Up
- Delete the corrupted WAL files and blocks that are filling up the disk (preferably from oldest date onwards).
4. Clean-up Debug pod and sever link to PV
Simply delete the deployment.
5. Redeploy the Prometheus-server
Which should now come up successfully as it has access to a empty drive ✅
How could we prevent this from happening in the future?
- Add alerts on disk usage on Prometheus-server
- Allow the volumes to auto-expand.
More on this in another blog post!
If you made it this far, here's the picture from my desk as the first rays of sun creeped in through my blinds as we wrapped up the incident..at 0800!


